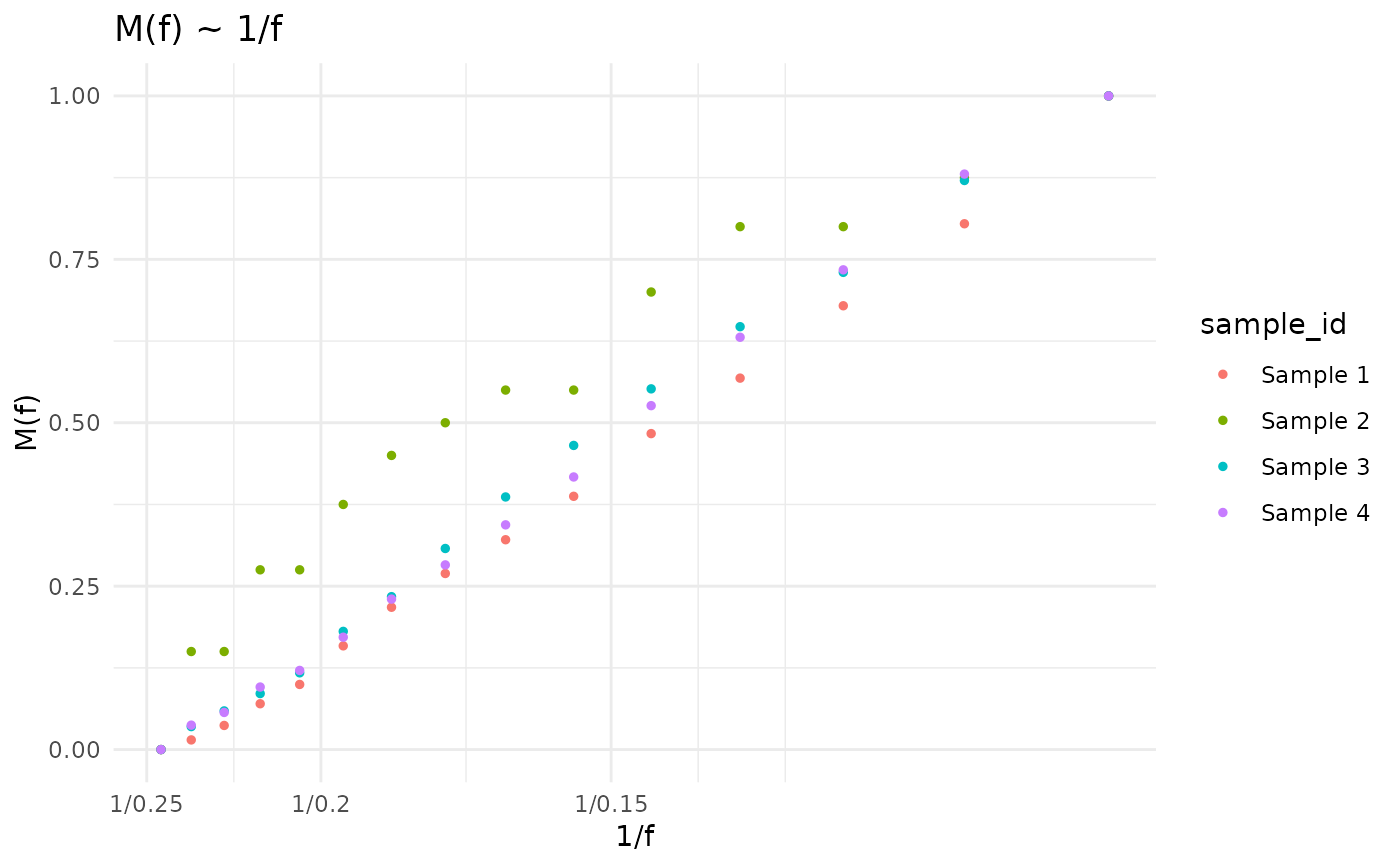
Plot M(f) ~ 1/f
Usage
# S3 method for cevo_Mf_1f_tbl
plot(
  x,
  from = 0.1,
  to = 0.25,
  scale = TRUE,
  geom = "point",
  mapping = NULL,
  ...
)
Arguments
- x
tibble with calc_Mf_1f() results
- from
min f to plot
- to
max f to plot
- scale
scale data?
- geom
ggplot geom to use, eg. geom_line()
- mapping
mapping
- ...
futher passed to geom_()
Examples
data("test_data")

test_data |>
  calc_Mf_1f() |>
  plot_Mf_1f()
#> Calculating Williams's M(f) ~ 1/f statistics, using VAF column