Mf_1f columns description:
sample_id
f
n - number of mutations in the VAF interval
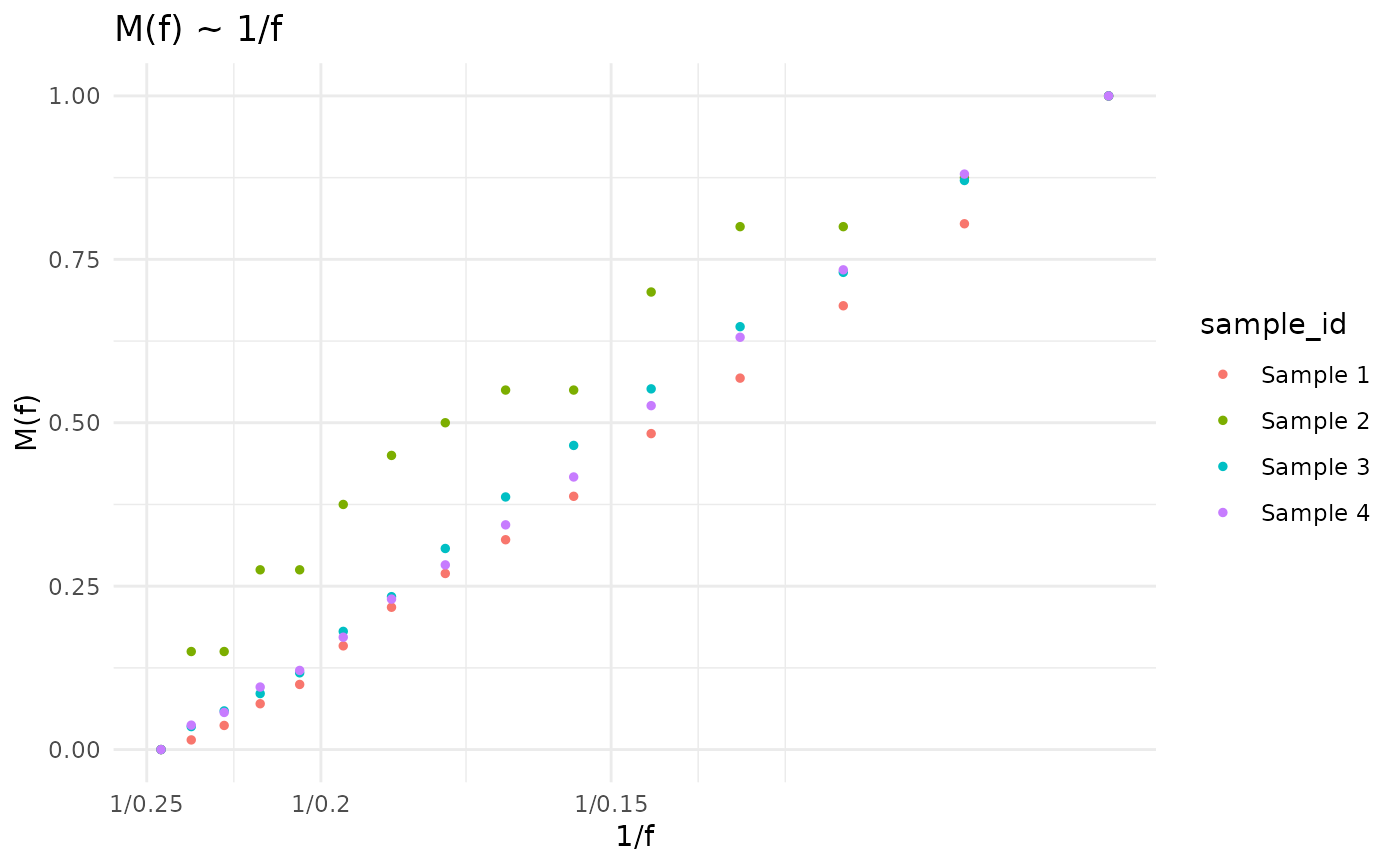
M(f)and1/fcolumns to plot William's statistics
Usage
calc_Mf_1f(object, ...)

# S3 method for cevodata
calc_Mf_1f(
  object,
  which_snvs = default_SNVs(object),
  column = get_frequency_measure_name(object, which_snvs),
  bins = 100,
  verbose = get_cevomod_verbosity(),
  ...
)

# S3 method for cevo_snvs
calc_Mf_1f(
  object,
  column = get_frequency_measure_name(object),
  bins = 100,
  verbose = get_cevomod_verbosity(),
  ...
)

plot_Mf_1f(object, ...)

# S3 method for cevodata
plot_Mf_1f(
  object,
  bins = NULL,
  from = 0.1,
  to = 0.25,
  scale = TRUE,
  geom = "point",
  ...
)

get_Mf_1f(object, model_name = "Mf_1f", verbose = TRUE, ...)
Arguments
- object
SNVs tibble object
- ...
Other arguments
- which_snvs
Which SNVs to use?
- column
VAF or CCF/2
- bins
Resolution of the cumulative tails calculation
- verbose
Verbose?
- from
min f to plot
- to
max f to plot
- scale
scale data?
- geom
ggplot geom to use, eg. geom_line()
- model_name
name of slot with Mf_1f statistics
Functions
calc_Mf_1f(): Calculate Williams M(f) ~ 1/f and saves it to cevodata$models$Mf_1fcalc_Mf_1f(cevodata): Method forobject calc_Mf_1f(cevo_snvs): Method for <cevo_snvs> objectplot_Mf_1f(cevodata): Plot M(f) ~ 1/fget_Mf_1f(): Get Mf_1f
Examples
data("test_data")
test_data |>
  calc_Mf_1f()
#> Calculating Williams's M(f) ~ 1/f statistics, using VAF column
#> <cevodata> dataset: test_data
#> Genome: unknown
#> SNV assays: snvs (default)
#> CNV assays: cnvs (default)
#> 4 cases, 4 samples, 1 sample per case
#> 16000 mutations total, 4000 +/- 0 mutations per case
#> Active models:

test_data |>
  plot_Mf_1f()
#> Mf_1f's not calculated yet. Calculating with default bins
#> Calculating Williams's M(f) ~ 1/f statistics, using VAF column