Site Frequency Spectra (or Variant Allele Frequency Spectra) are the main statistic used by cevomod.
Usage
calc_SFS(object, ...)

# S3 method for cevodata
calc_SFS(
  object,
  which_snvs = default_SNVs(object),
  column = get_frequency_measure_name(object, which_snvs),
  bins = NULL,
  verbose = get_cevomod_verbosity(),
  ...
)

# S3 method for cevo_snvs
calc_SFS(
  object,
  column = get_frequency_measure_name(object),
  bins = NULL,
  verbose = get_cevomod_verbosity(),
  ...
)

plot_SFS(object, ...)

# S3 method for cevodata
plot_SFS(object, mapping = NULL, ..., geom = "bar")

get_SFS(object, model_name = "SFS", verbose = TRUE, ...)
Arguments
- object
SNVs tibble object
- ...
other arguments
- which_snvs
Which SNVs to use?
- column
VAF or CCF/2
- bins
Resolution of the cumulative tails calculation
- verbose
verbose?
- mapping
aes()
- geom
Geom
- model_name
name of slot with SFS statistics
Functions
calc_SFS(): Calculates spectra for all samples and saves and saves them in cevodata$models$SFS tibble.SFS columns description:
y number of mutations in the frequency interval
y_scaled with y values scaled to the range 0-1
calc_SFS(cevodata): method for cevodata objectcalc_SFS(cevo_snvs): method for cevo_snvs objectplot_SFS(): Plot SFSplot_SFS(cevodata): Plot SFSget_SFS(): Get SFS
Examples
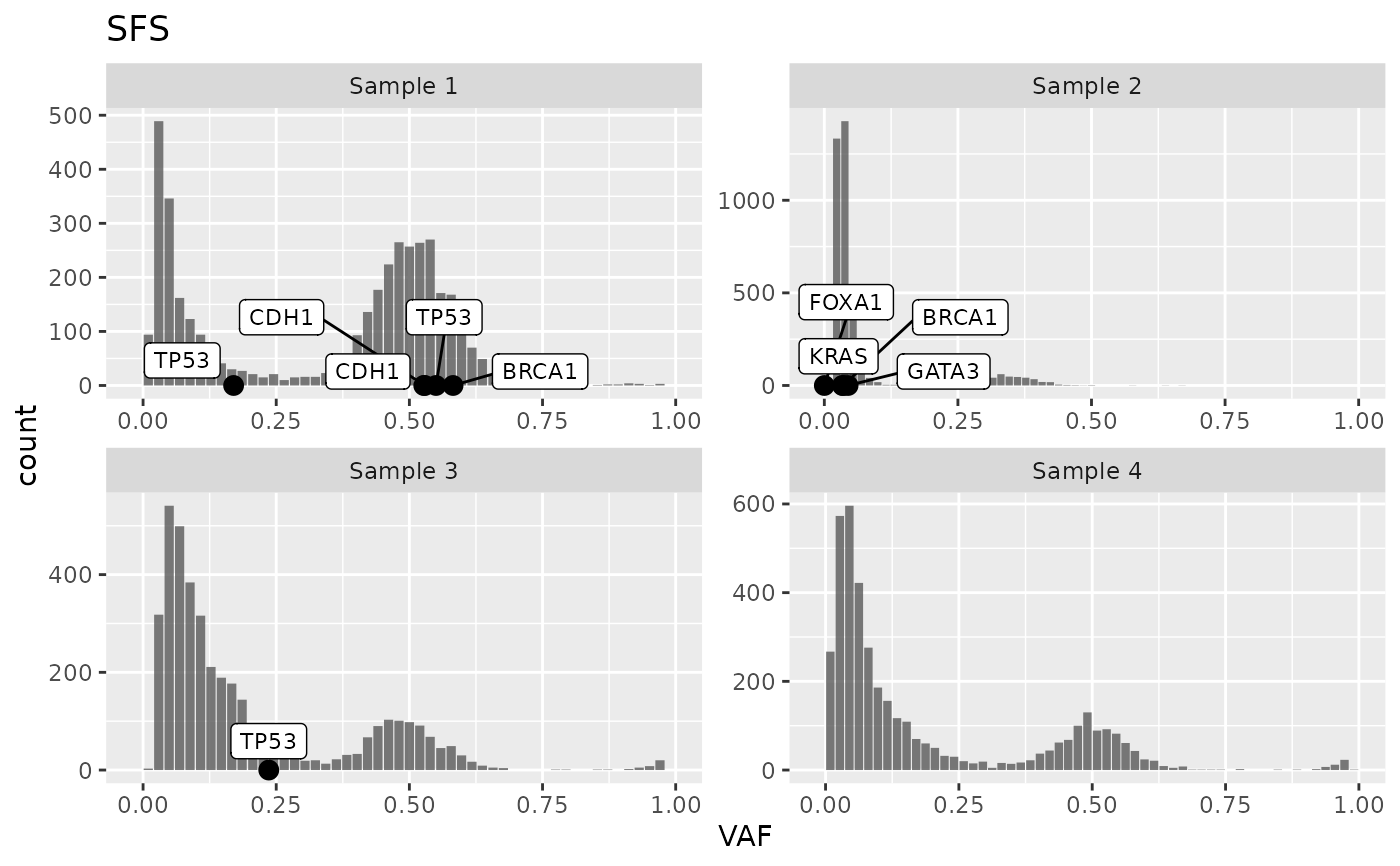
data("test_data")

test_data |>
  calc_SFS() |>
  plot_SFS() +
  layer_mutations(test_data, mapping = ggplot2::aes(x = VAF), drivers = "BRCA")
#> Calculating SFS statistics
#> Calculating f intervals, using VAF column
#> Warning: Ignoring unknown aesthetics: width
#> Warning: Ignoring unknown aesthetics: shape