cumulative_tails columns:
f
n column with the number of mutations in the f interval
y cumulative tail value
y_scaled with y values scaled to the range 0-1
Usage
calc_cumulative_tails(object, ...)

# S3 method for cevodata
calc_cumulative_tails(
  object,
  which_snvs = default_SNVs(object),
  column = get_frequency_measure_name(object, which_snvs),
  bins = 100,
  verbose = get_cevomod_verbosity(),
  ...
)

# S3 method for cevo_snvs
calc_cumulative_tails(
  object,
  column = get_frequency_measure_name(object),
  bins = 100,
  verbose = get_cevomod_verbosity(),
  ...
)

plot_cumulative_tails(object, ...)

# S3 method for cevodata
plot_cumulative_tails(object, scale_y = TRUE, scales = "loglog", ...)
Arguments
- object
SNVs tibble object
- ...
passed to geom_line()
- which_snvs
Which SNVs to use?
- column
VAF or CCF/2
- bins
Resolution of the cumulative tails calculation
- verbose
Verbose?
- scale_y
scale y vaules to 1?
- scales
loglog/semilog
Functions
calc_cumulative_tails(cevodata): Calculate the cumulative tails and saves to cevodata$models$cumulative_tails tibblecalc_cumulative_tails(cevo_snvs): Calculate the cumulative tailsplot_cumulative_tails(cevodata): Shortcut to plot cum tails from SNVs dataframe
Examples
data("test_data")
test_data |>
calc_cumulative_tails()
#> Calculating cumulative tails, using VAF column
#> <cevodata> dataset: test_data
#> Genome: unknown
#> SNV assays: snvs (default)
#> CNV assays: cnvs (default)
#> 4 cases, 4 samples, 1 sample per case
#> 16000 mutations total, 4000 +/- 0 mutations per case
#> Active models:
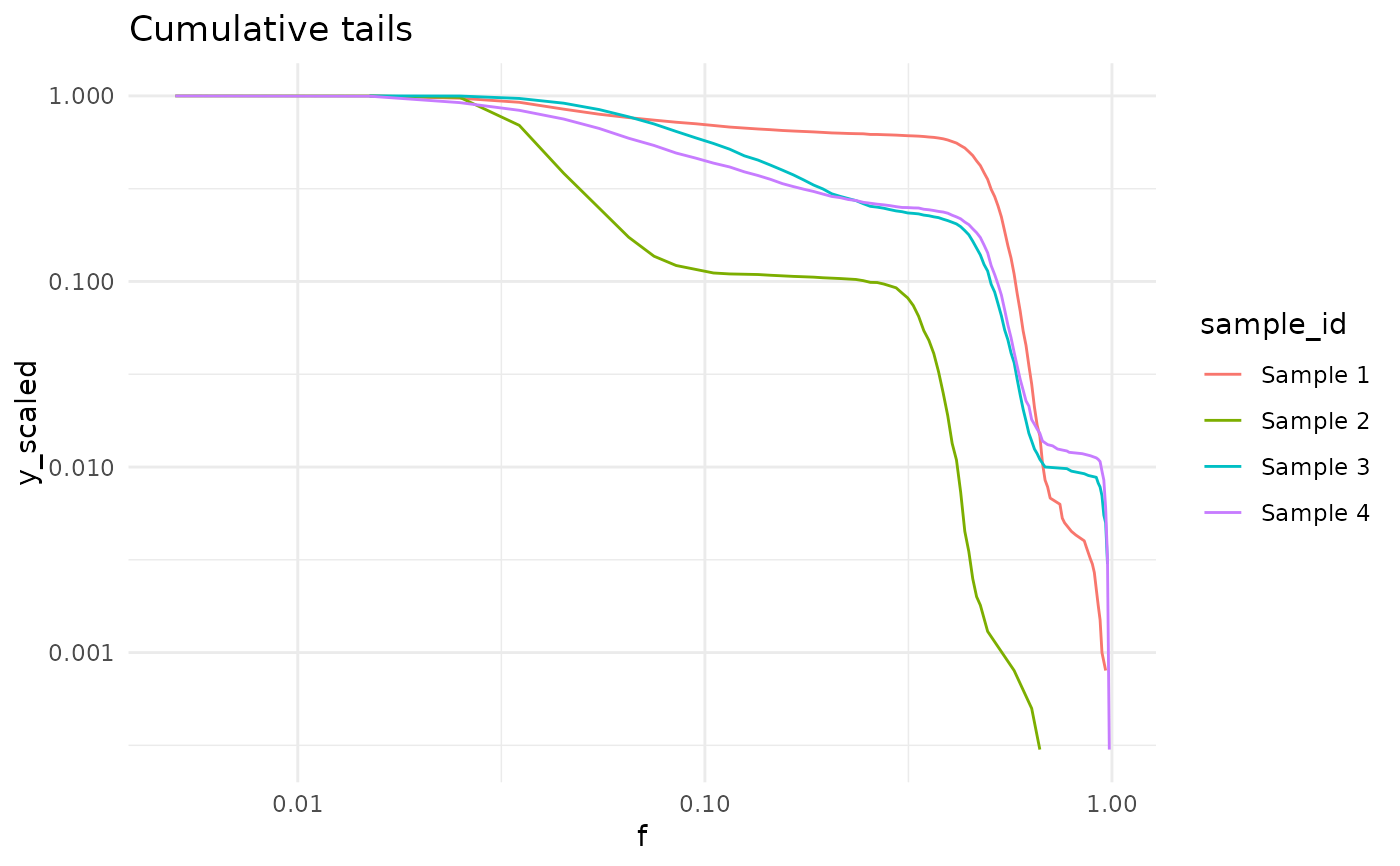
test_data |>
plot_cumulative_tails()
#> Calculating cumulative tails, using VAF column